
The term “inflation” appears in news headlines more often than before. The Russian-Ukrainian war as well as the quick economic recovery from the pandemic have increased prices for practically everything, causing inflation to hit decades-high levels globally.
What is a better way to gauge inflation other than the Consumer Price Index (CPI)?
Start Capitalising on Market Moves
List of Contents
- Introduction to CPI
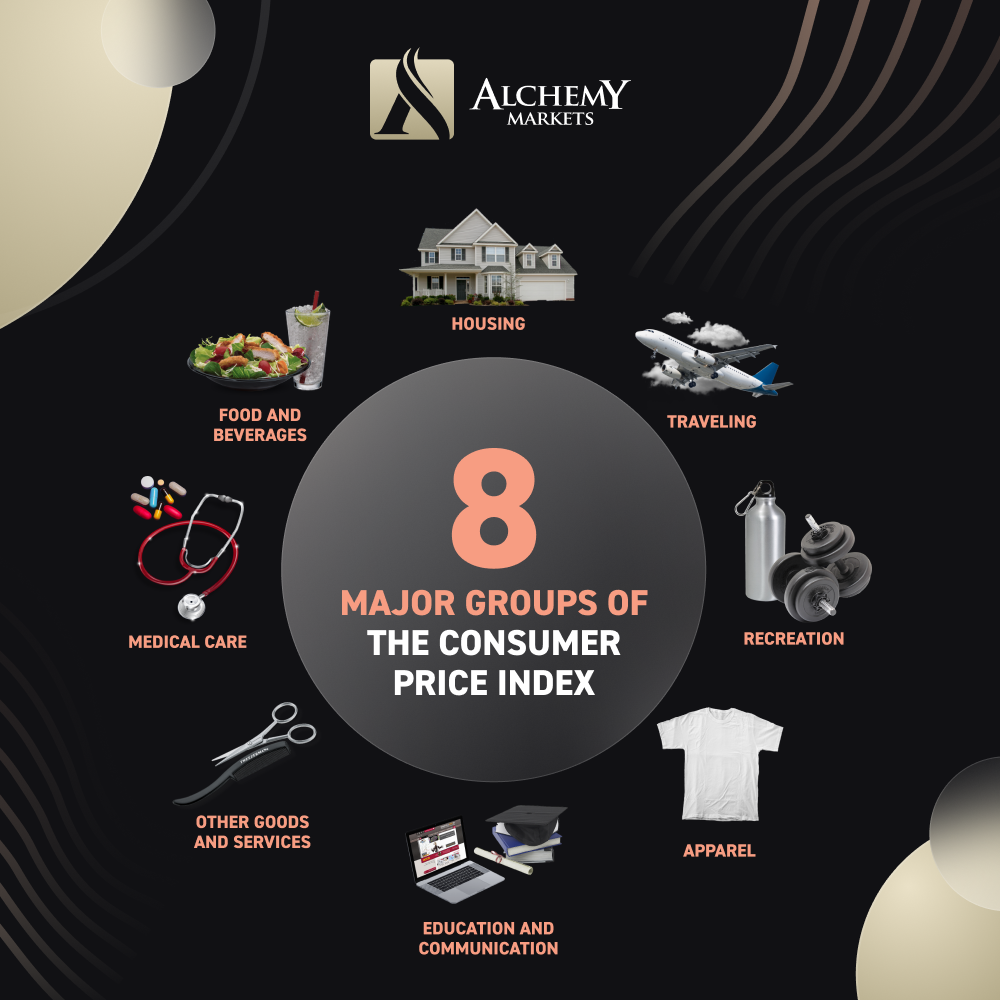
- What is Included In the CPI?
- Uses of CPI
- Calculating CPI
- Reading the CPI
- Core CPI
- Why Should We Care About the CPI?
- Which Pairs Are Affected the Most?
- Real Data
- Current Inflation Rate
- Historical Inflation Trend
Introduction to CPI
The Consumer Price Index is a measure of changes in the prices of a basket of goods and services. In the United States, the Bureau of Labor Statistics is responsible for carrying out surveys, collecting data, and publishing the CPI reports every month.
Check out our Advanced Economic Calendar Here
What is included in the CPI?
Uses of CPI
Economic Indicator
- CPI, as the most popular inflationary measure, is used to assess the performance of existing economic policies. The Fed and other pertinent authorities will then use data and trends from the CPI to make changes and implement new policies.
- Regular consumers like us, businesses, and other entities also use CPI numbers to make various economic decisions
Means of Adjusting Dollar Value
- We must thank CPI because it serves as a means to adjust the dollar value for income tax calculations. This helps avoid inflation-related rises in tax rates
- Consumers’ income payments such as Social Security and eligibility levels for government assistance are adjusted based on the CPI
- You can also use CPI as a reason to bargain for wage increments
Calculating CPI
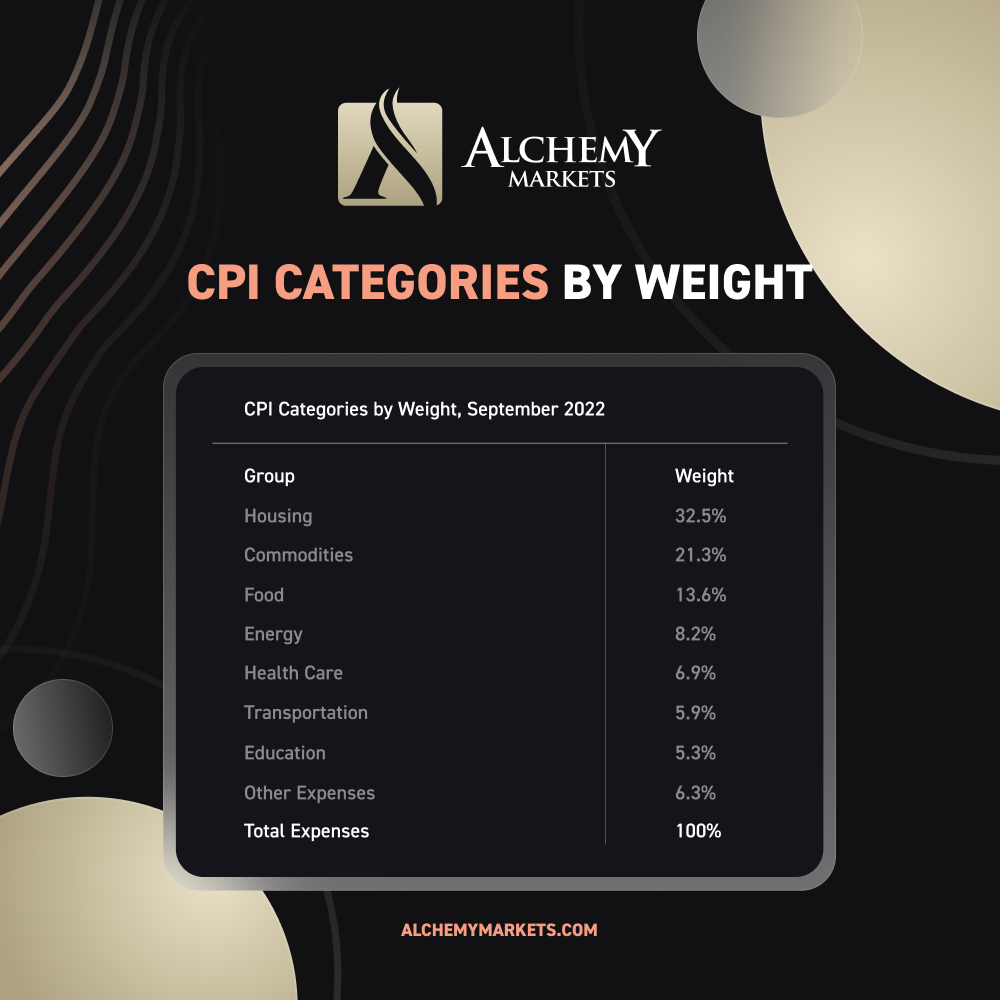
The CPI is calculated as a weighted average of the changes in prices of the basket of goods and services The table below shows the relative weight for each of the major categories
The formula is expressed as:
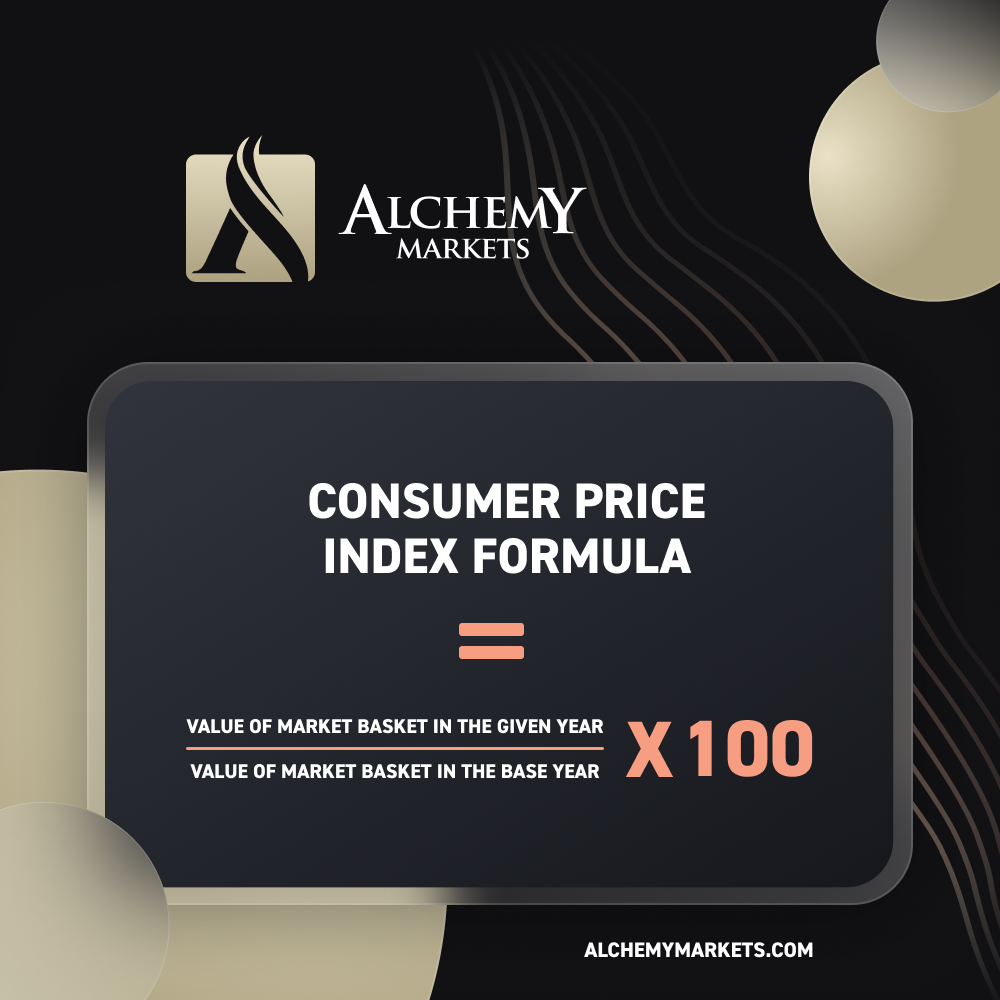
We won’t bore you with all the numerical examples. Being able to interpret what the numbers mean is far more important for our trading, so let’s move on to the next section.
Reading the CPI
CPI can be presented in various ways based on how it is being calculated.

Image 1: Snapshot of Trading Central’s Economic Calendar
Let’s use the most recent report as an example – Inflation Rate YoY SEP
Inflation Rate YoY SEP refers to the Consumer Price Index for September 2022. Year-over-year (YoY) means the current month numbers are calculated and compared to the same month from last year, ie September 2021. This shows us how much the prices of goods and services have risen compared to the same time last year.
An actual print of 8.2% compared to a previous reading of 8.3% means the inflation has slowed down in the slightest bit. The actual also matched the consensus. If there is a significant disparity between actual and forecast, it could lead to a knee-jerk reaction and volatile moments in the markets as market participants digest the information.
On the other hand, MoM (Month-over-month) is a comparison of the latest data to the previous month’s reading.
Access Trading Central for free
Core CPI
We can also notice a report titled ‘Core Inflation Rate’ in Image 1.
The core Inflation Rate or Core CPI is just CPI without the elements of food and energy. You might be asking why were they removed from the calculation.
Food and energy are two of the most volatile components in consumer spending. By excluding them we can obtain a more consistent number compared to the headline CPI. This has some important implications, at least for economists and policymakers.
> Headline inflation data (CPI) may give a false representation of the underlying inflationary trend.
For instance, a temporary rise in energy and food prices may lead the authorities to tighten policies more frequently. This may in turn slow down the economy.
By the same token, if monetary policies were overly loose because of a short-term decline in food and energy prices, we may lay a landmine for future inflation.
We are not, however, negating the importance of CPI. Different types of indices and methodologies can provide fresh perspectives on the health of the economy.
Check out our Advanced Economic Calendar Here
Why Should We Care as Traders
Policymakers refer to the CPI data to make informed decisions about monetary policies.
Say the CPI has been consistently increasing and the central bank begins to carry out quantitative tightening, interest rates rise and subsequently affect the outlook of the pairs that we are trading. We need to take those updates into account when analysing our trades.
CPI can also potentially spur a rise in volatility across major FX pairs and other instruments. Traders must reinforce their risk management to weather rough and choppy markets.
Not only that, but we can also apply it to our personal lives as well. As traders, we have the advantage of being more informed about the current economic situation because we stay on top of the news for our trading business. By noticing a change in inflationary trends, we can make swift and educated decisions for our personal finances.
Stay Up to Date by reading our Market Talk
Which Pairs Are Affected the Most?
The answer depends on which country we are discussing. If we are talking about the US CPI, then, of course, the USD quoted instruments such as the FX majors, Gold, and US equities will be impacted the most.
Do note that the markets are not obligated to move in a way that the facts in textbooks suggest. There are just too many variables at play that can affect prices and sentiment.
Nonetheless, almost everything has some degree of correlation in the financial markets and with news events as significant as the CPI, the effects will ripple through a wide range of asset classes.
Browse our Full Products Offering here
Current Inflation Rate
Period: September 2022
The Consumer Price Index YoY for September 2022 is 8.2% matching the forecast, and 0.1% lower than the most recent print.
The Consumer Price Index MoM for September 2022 is 0.4%, beating expectations by 0.1% and an increase of 0.3% compared to the previous reading.
Historical Inflation Trend
Period: October 2021- September 2022

Alchemy Markets.
The chart above shows the inflationary trend in the U.S. for the past 12 months.
The headline CPI has stopped increasing for 3 consecutive readings. Has inflation peaked?
Average Inflation Rate in 2021: 4.7%
Average Inflation Rate in 2020: 1.2%
Ru Yi
Financial Market Analyst
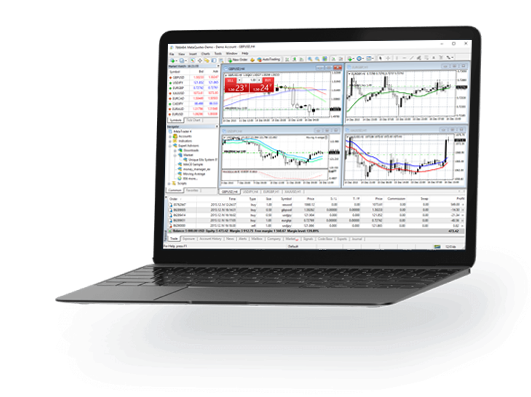
Sign up and trade with Alchemy Markets now.
The only place where you get to trade more than 1000 instruments including Stocks, FX, Cryptos, and many more with ultra-low spreads and institutional-grade liquidity.


